


CommandBar is a user experience platform: a toolkit to make products easier to learn and features easily discoverable.
Tyler, designer and analytics owner, recognized the need to monitor how core features of CommandBar are utilized week by week to ensure the tool meets its full potential.
Background
CommandBar, brainchild of James Evans, Richard Freling, and Vinay Ayyala, started as a solution to their personal challenge in codePost, a web-based grading tool for computer science.
The vision was simple: allow users to express their intent through a search bar and guide them to the desired action, bypassing the maze of menus.
From its inception, CommandBar resonated with big names like ClickUp, HashiCorp, and Netlify, securing a whopping $23.8 million in funds to date. The interface has now evolved, not just offering a search experience but also AI chat, questlists, nudges, and other features to improve the user experience (e.g., user onboarding and user feedback).
Challenge
CommandBar stands at a crossroads: meeting business needs efficiently, scaling, and retaining simplicity. Every company that is starting to scale is tempted to pile on features to be the go-to solution that covers all user requests.
But this can backfire, making it a jack-of-all-trades and master of none, rather than a laser-focused indispensable tool. Adding a slew of features without a clear strategy might confuse users. They could feel overwhelmed, not fully use the tools, or even turn to simpler alternatives.
CommandBar is trying to avoid this trap by closely monitoring the adoption and usage of each of these. If users are all over 'Questlists' but ignoring ‘Nudges', it signals where the real value and focus should be. These insights ensure feature development aligns with user needs.
Adding more and more functionalities also creates the challenge of expanding usage with the current customers to increase revenue.
To sum up, while expanding on different features, CommandBar’s primary challenge is to make sure the depth in each of these is great. And that users stick around and expand.
The mantra? Depth over breadth. With analytics and a focus on quality, CommandBar can strike the right balance.
The Solution
Using the Feature Report: depth over breadth
Tyler takes care of Design at Commandbar and is also the owner of product analytics for the company.
The first thing he did, after starting to use June, was to setup a Feature Report for each of CommandBar’s core features.
These features included
- HelpHub (an interface for bringing help content, blogs, community posts, and other media in-product)
- AI Chat (allows users to ask questions from a bot trained on company content)
- Nudges (proactive user suggestions)
- Questlist (their answer to the common checklist)
- Spotlight (natural language search)
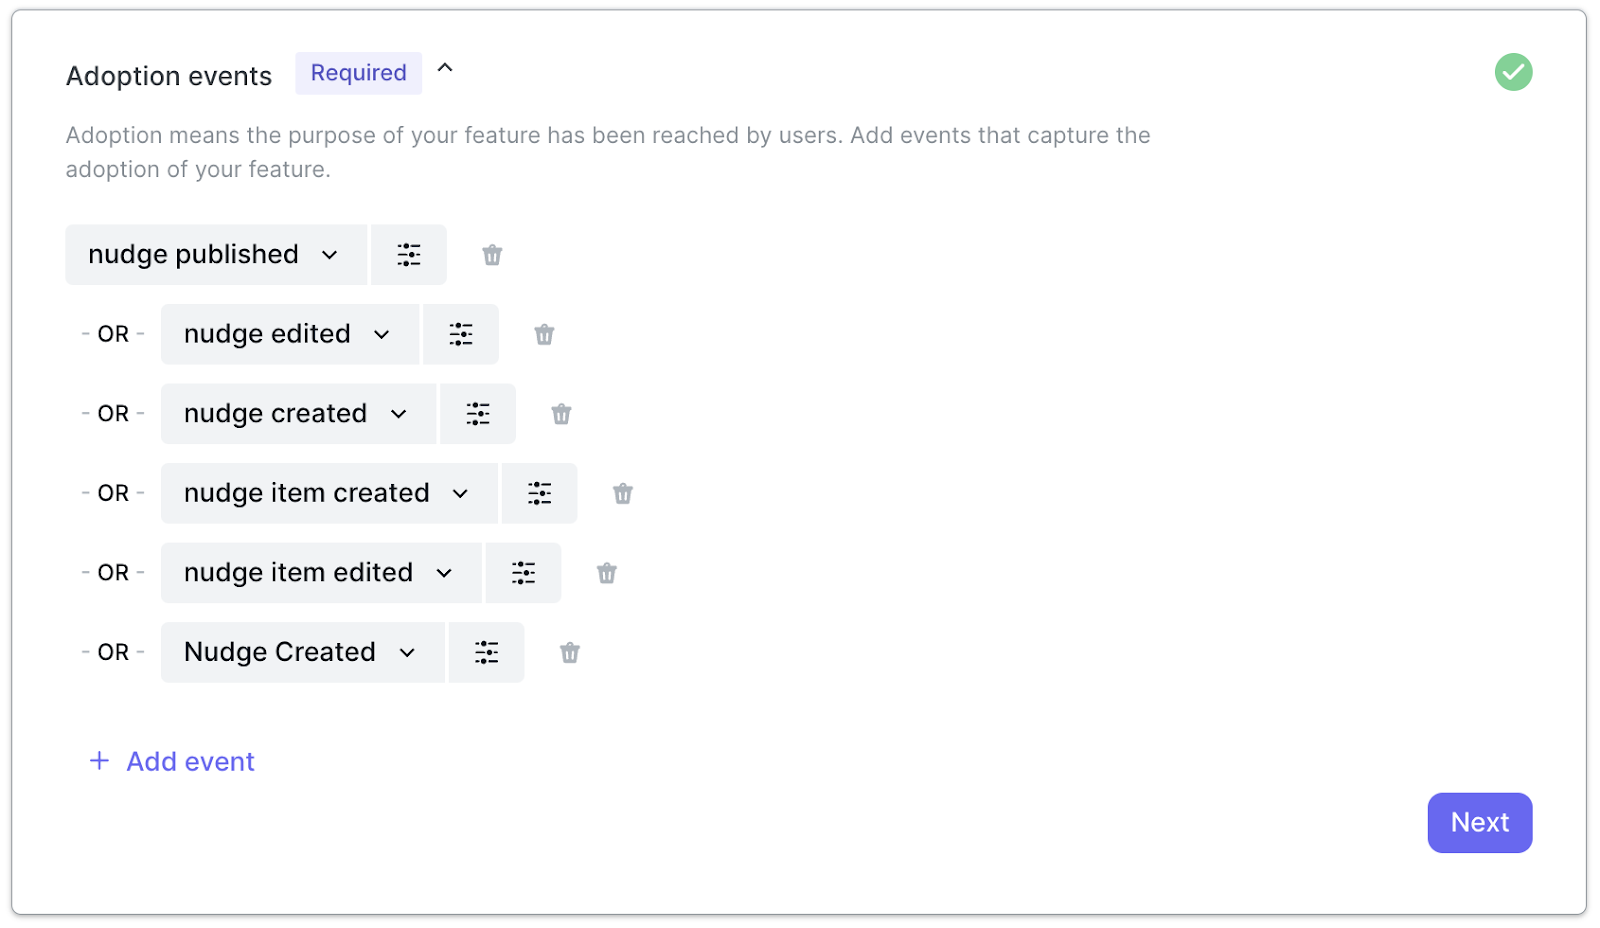
In most cases there are multiple events that map to one feature. For this reason, Tyler added all of them inside of the setup of the report to make sure that every interaction with the feature would be captured and measured.
Once the setup was done, Tyler started focusing mostly on adoption and retention over time. The latter one has been the focus metric for the team as good feature retention is a clear signal that value is delivered to users on an ongoing basis.
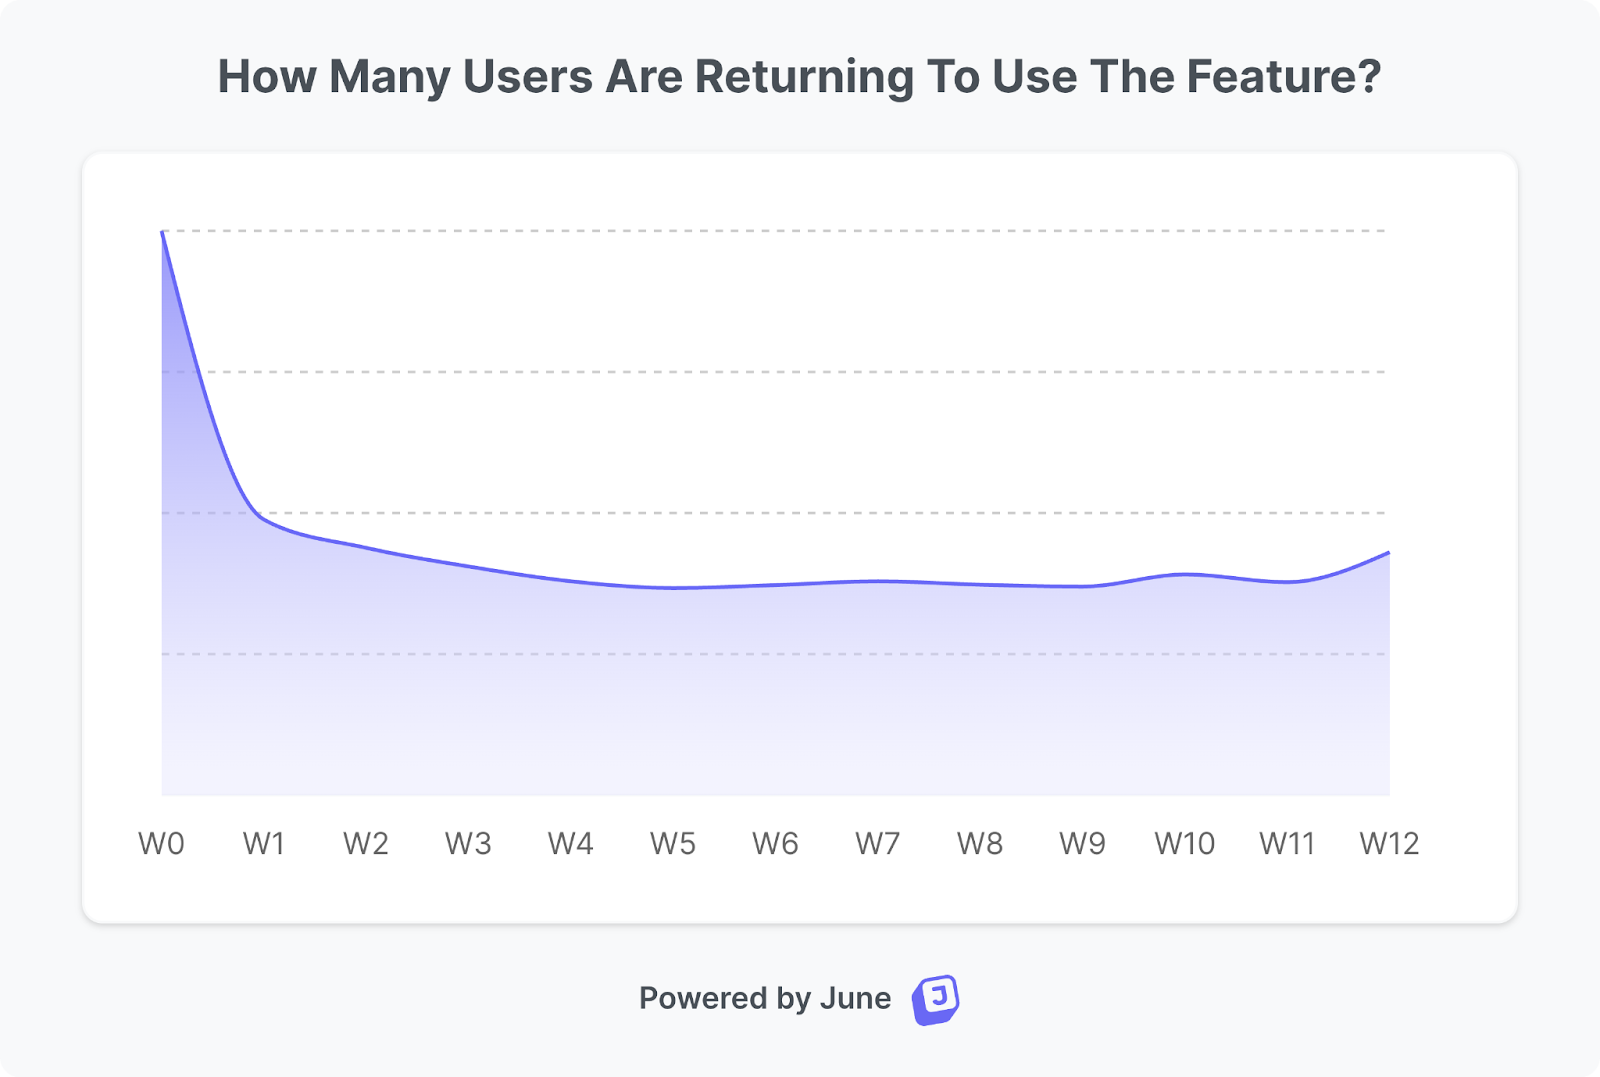
For example, when Nudges were launched, the retention cure stabilized quickly but at a low value. The flat curve signaled that once users interact with it for 2 / 3 weeks in a row, they would actually keep using it over time.
As you can see in the figure the fluctuation (A) of retention is minimal meaning that more or less the number of people that came back to use the feature at W2 / W3 is roughly the same as the one at W10+. The team basically managed to build a sticky feature!
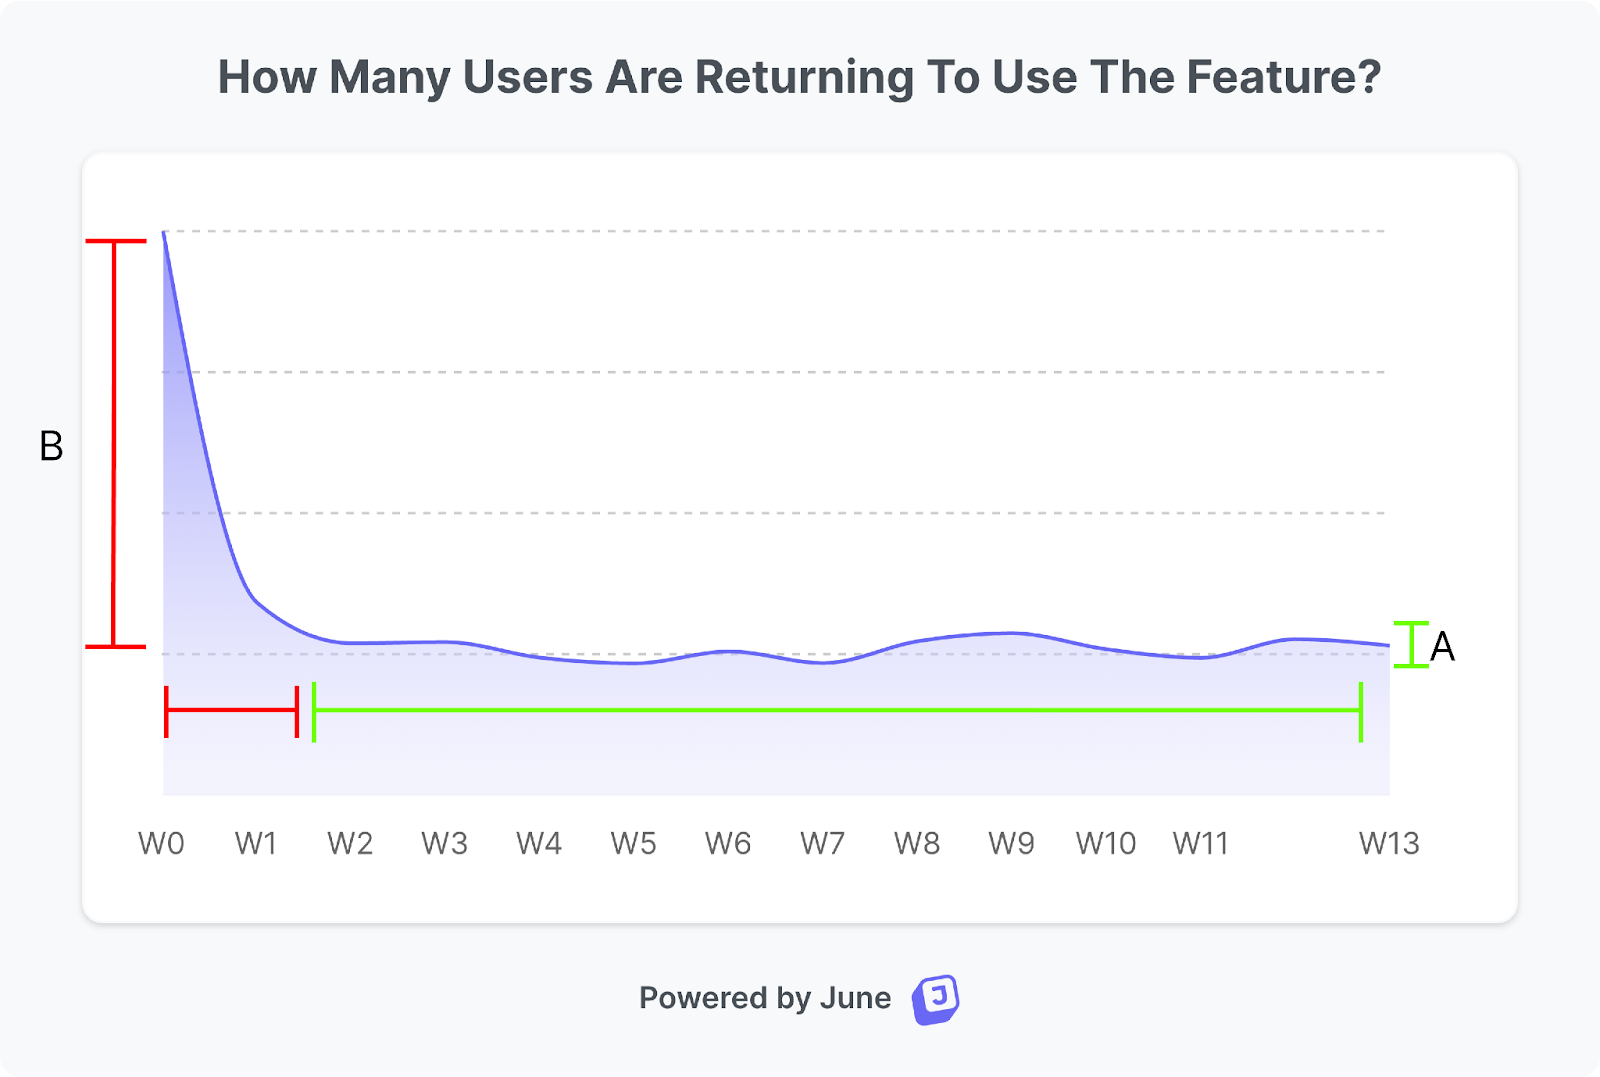
On the other hand though, the number of people that came back at W1/W2 was quite low (B). Basically this meant that “activation” on Nudges wasn’t great. With these insights in hand, Tyler redesigned the first experience and the first touchpoints users have with Nudges which moved up the whole curve.
Comparing features
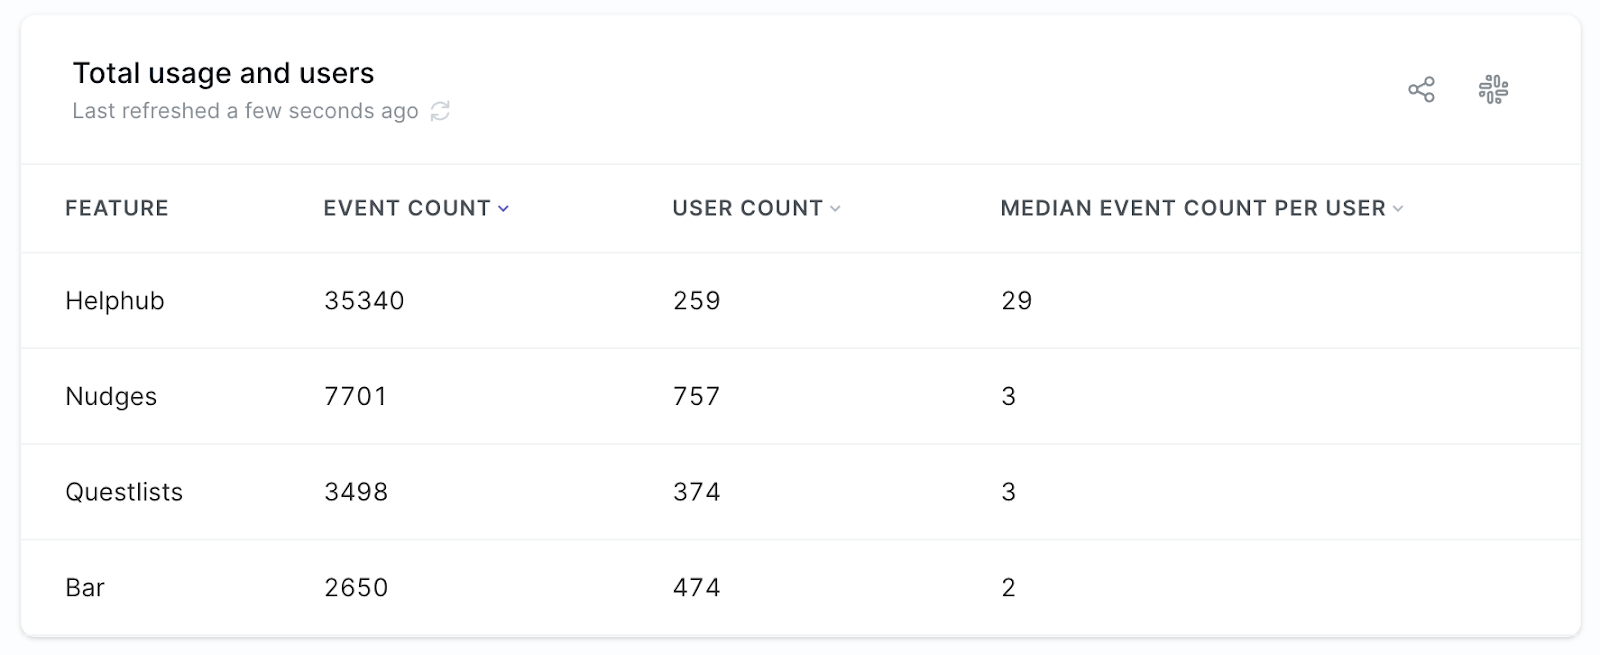
After deep diving into all the single features, Tyler set up a Feature Audit report to get a bird's eye view on how the overall performance of the product looked like.
This report helped the team answer the most intuitive question:
“What are people doing in the product?”
Looking at feature individually is interesting but Tyler wanted to go deeper and understand how many companies were using only 1 feature per week, how many used 2 and how many 3+
Given that June doesn’t have a prebuilt report for this kind of question, Tyler used the AI powered SQL editor to add an extra card to the Feature Audit report.
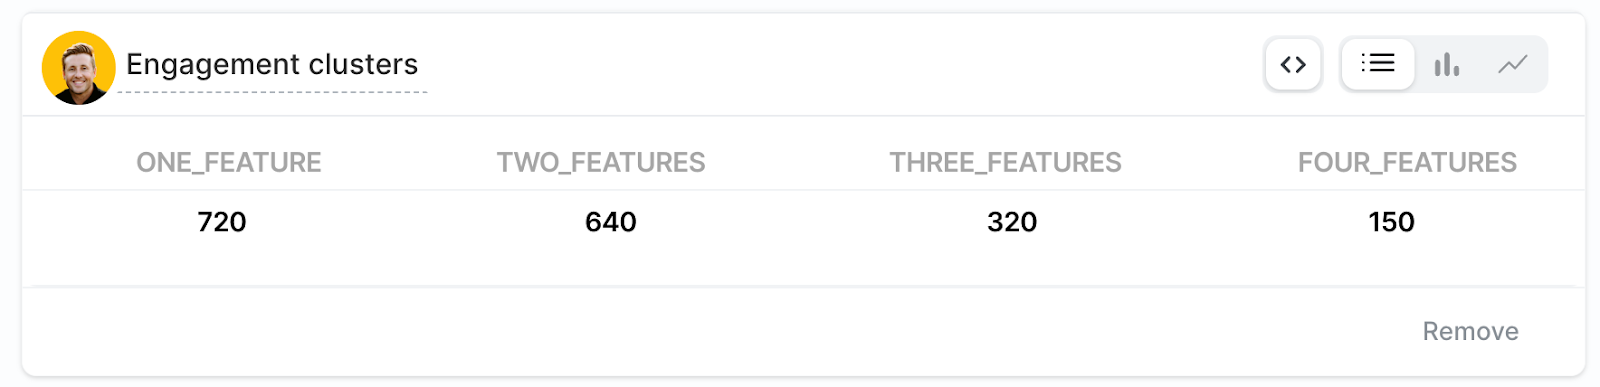
This information is also used by CS and Sales to make sure companies expand in usage (and revenue) over time.
Outcome
Tyler and the whole Commandbar team are now able to quickly monitor their core features.
This has helped them to iterate on the right things to make sure every piece of the puzzle fits in well and that the depth of the feature is good enough to keep customers satisfied in the long term.


